Now that we’ve got basic SQL queries going, we want to collect some actionable intel. A good measure of any SQL database performance is how well indexes are utilised.
This isn’t new
All queries we’re about to share are hardly a revelation. What we however want to achieve is to have an idea of how that information changes over time
Index utilisation
input {
	############################################################# Index Maintenance ############################################################################
	jdbc {
		id => "master_index_maintenance"
		jdbc_driver_library => "path\to\jdbc\lib\mssql-jdbc-7.2.1.jre8.jar"
		jdbc_driver_class => "com.microsoft.sqlserver.jdbc.SQLServerDriver"
		jdbc_connection_string => "jdbc:sqlserver://<your connection string>"
		jdbc_user => nil
		schedule => "*/15 * * * *"
		statement => "	DECLARE @db_id INT
						DECLARE @db_name NVARCHAR(120)
						DECLARE @index_data TABLE(
												[database_name] NVARCHAR(128) NOT NULL,
												table_name sysname NOT NULL,
												index_name sysname NULL,
												index_type TINYINT NOT NULL,
												user_seeks bigint NOT NULL,
												user_scans bigint NOT NULL,
												user_lookups bigint NOT NULL,
												user_updates bigint NOT NULL
											   );

						SET NOCOUNT ON
						DECLARE @dbs table ([db_name] sysname)
						DECLARE @db_query_sql nvarchar(4000)
						SET @db_query_sql='select ''?'' as [db_name] from [?].sys.tables t WHERE t.name = ''Users''';

						INSERT INTO @dbs ([db_name]) EXEC sp_msforeachdb @db_query_sql
						SET NOCOUNT OFF

						DECLARE db_id_cursor CURSOR FOR SELECT DB_ID([db_name]), [db_name] FROM @dbs FOR READ ONLY
						OPEN db_id_cursor
						FETCH NEXT FROM db_id_cursor INTO @db_id, @db_name;
						WHILE @@FETCH_STATUS = 0
						BEGIN
							DECLARE @sql NVARCHAR(MAX) = CAST(N'USE [' + @db_name + '];

							SELECT ''' + @db_name + ''', t.[name], ix.[name], ix.[type], us.user_seeks, us.user_scans, us.user_lookups, us.user_updates
							FROM sys.dm_db_index_usage_stats us
							INNER JOIN sys.indexes ix ON us.object_id = ix.object_id and ix.index_id = us.index_id
							INNER JOIN sys.tables t ON ix.object_id = t.object_id
							WHERE us.database_id = ' + CAST(@db_id AS NVARCHAR(10)) AS NVARCHAR(MAX));

							INSERT INTO @index_data EXEC sys.sp_executesql @sql;
							FETCH NEXT FROM db_id_cursor INTO @db_id, @db_name;
						END
						CLOSE db_id_cursor
						DEALLOCATE db_id_cursor
						SELECT * FROM @index_data"
		add_field => {
						"sql_instance" => "SQL2"
					}
	}
	################################################################################################################################################################
}
output {
	elasticsearch {
		hosts => "elasticsearch:9200"
		index => "sql-index-stats-%{+YYYY.MM}"
	}
}
Missing indexes
This one is a bit more interesing in a sense that we will get actual index hints. It is not a silver bullet though – this still needs to be analysed by humans for best results.
input {
	############################################################# Master sp_WhoIsActive ############################################################################
	jdbc {
		id => "master_missing_indexes"
		jdbc_driver_library => "path\to\jdbc\lib\mssql-jdbc-7.2.1.jre8.jar"
		jdbc_driver_class => "com.microsoft.sqlserver.jdbc.SQLServerDriver"
		jdbc_connection_string => "jdbc:sqlserver://<your connection string>"
		jdbc_user => nil
		schedule => "1 */2 * * *"
		statement => "	DECLARE @db_id INT
						DECLARE @db_name NVARCHAR(120)
						DECLARE @index_data TABLE(
												[database_name] NVARCHAR(128) NOT NULL,
												table_name sysname NOT NULL,
												unique_compiles bigint NOT NULL,
												user_seeks bigint NOT NULL,
												user_scans bigint NOT NULL,
												avg_total_user_cost float NULL,
												avg_user_impact float NULL,
												overall_impact float NOT NULL,
												sql_code NVARCHAR(MAX) NOT NULL
											   );

						SET NOCOUNT ON
						DECLARE @dbs table ([db_name] sysname)
						DECLARE @db_query_sql nvarchar(4000)
						SET @db_query_sql='select ''?'' as [db_name] from [?].sys.tables t WHERE t.name = ''Users''';

						INSERT INTO @dbs ([db_name]) EXEC sp_msforeachdb @db_query_sql
						SET NOCOUNT OFF

						DECLARE db_id_cursor CURSOR FOR SELECT DB_ID([db_name]), [db_name] FROM @dbs FOR READ ONLY
						OPEN db_id_cursor
						FETCH NEXT FROM db_id_cursor INTO @db_id, @db_name;
						WHILE @@FETCH_STATUS = 0
						BEGIN
							DECLARE @sql NVARCHAR(MAX) = CAST(N'USE [' + @db_name + '];

							WITH index_definitions (table_name, unique_compiles, user_seeks, users_scans, avg_total_user_cost,
							avg_user_impact, [overall_impact], column_names, included_columns)
							AS (
								SELECT TOP(600) object_name(c.object_id) AS table_name,
								a.unique_compiles, a.user_seeks, a.user_scans, a.avg_total_user_cost, a.avg_user_impact,
								a.avg_total_user_cost * a.avg_user_impact * (a.user_seeks + a.user_scans) AS [overall_impact],
								case when c.equality_columns is not null and c.inequality_columns is not null then c.equality_columns + '', '' + c.inequality_columns
								when c.equality_columns is not null and c.inequality_columns is null then c.equality_columns
								when c.inequality_columns is not null then c.inequality_columns
								END AS column_names,
								c.included_columns
								FROM sys.dm_db_missing_index_group_stats a
								inner join sys.dm_db_missing_index_groups b ON a.group_handle = b.index_group_handle
								inner join sys.dm_db_missing_index_details c on c.index_handle = b.index_handle
								where database_id = ' + CAST(@db_id AS NVARCHAR(10)) + '
								and equality_columns is not null
							)
							SELECT '''+ @db_name +''' AS [database], table_name, unique_compiles, user_seeks, users_scans, avg_total_user_cost, avg_user_impact, overall_impact, ''CREATE NONCLUSTERED INDEX IX_'' + REPLACE(REPLACE(REPLACE(index_definitions.column_names, ''], ['', ''_''), ''['', ''''), '']'', '''')
									+ '' on '' + index_definitions.table_name + '' ('' + index_definitions.column_names + '') INCLUDE ('' + index_definitions.included_columns + '')''  AS [sql_code]
							FROM index_definitions WHERE index_definitions.included_columns IS NOT NULL
							UNION
							SELECT '''+ @db_name +''' AS [database], table_name, unique_compiles, user_seeks, users_scans, avg_total_user_cost, avg_user_impact, overall_impact, ''CREATE NONCLUSTERED INDEX IX_'' + REPLACE(REPLACE(REPLACE(index_definitions.column_names, ''], ['', ''_''), ''['', ''''), '']'', '''')
									+ '' on '' + index_definitions.table_name + '' ('' + index_definitions.column_names + '')'' AS [sql_code]
							FROM index_definitions WHERE index_definitions.included_columns IS NULL' AS NVARCHAR(MAX));

							INSERT INTO @index_data EXEC sys.sp_executesql @sql;
							FETCH NEXT FROM db_id_cursor INTO @db_id, @db_name;
						END
						CLOSE db_id_cursor
						DEALLOCATE db_id_cursor
						SELECT * FROM @index_data;"
		add_field => {
						"sql_instance" => "SQL2"
					}
	}
	################################################################################################################################################################
}
output {
	elasticsearch {
		hosts => "elasticsearch:9200"
		index => "sql-missing-indexes-%{+YYYY.MM}"
	}
}
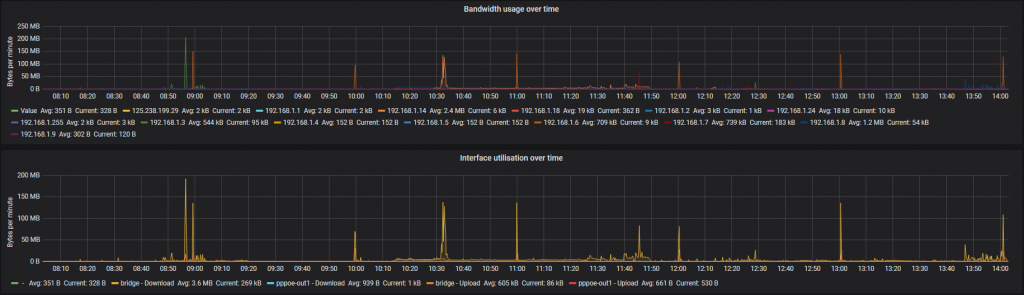
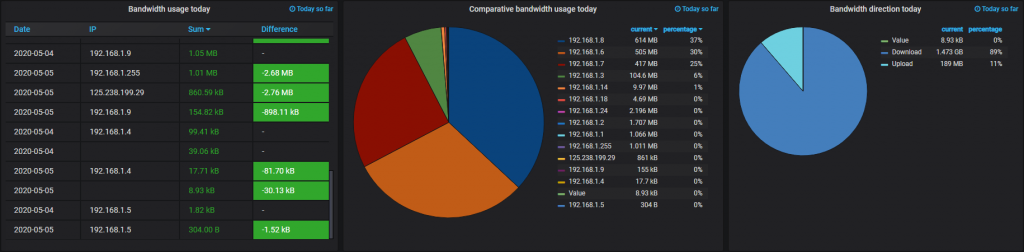
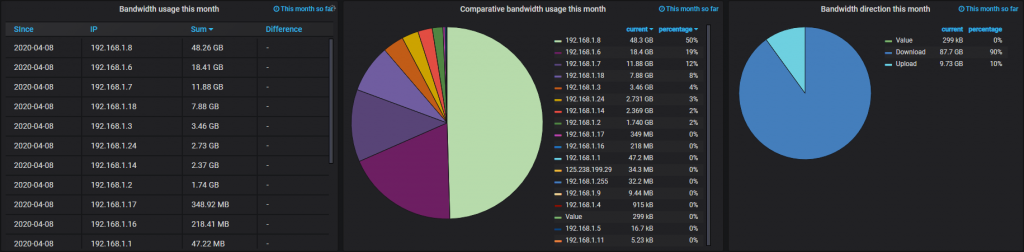
With data collection out of the way it’s time to move on to plotting graphs. Grafana is quite easy to pick up so instead of repeating official documentation we’d share a few dashboards we have in place
{
"annotations": {
"list": [
{
"builtIn": 1,
"datasource": "-- Grafana --",
"enable": true,
"hide": true,
"iconColor": "rgba(0, 211, 255, 1)",
"name": "Annotations & Alerts",
"type": "dashboard"
}
]
},
"editable": true,
"gnetId": null,
"graphTooltip": 0,
"id": 33,
"iteration": 1584410507264,
"links": [],
"panels": [
{
"collapsed": false,
"datasource": null,
"gridPos": {
"h": 1,
"w": 24,
"x": 0,
"y": 0
},
"id": 74,
"panels": [],
"title": "Index usage",
"type": "row"
},
{
"columns": [],
"datasource": "Elasticsearch [index-stats]",
"fontSize": "100%",
"gridPos": {
"h": 5,
"w": 24,
"x": 0,
"y": 1
},
"id": 72,
"interval": "1h",
"links": [],
"maxPerRow": null,
"options": {},
"pageSize": null,
"repeat": "Database",
"repeatDirection": "v",
"scopedVars": {
"Database": {
"selected": true,
"text": "All",
"value": "All"
}
},
"scroll": true,
"showHeader": true,
"sort": {
"col": 4,
"desc": true
},
"styles": [
{
"alias": "Table",
"align": "auto",
"dateFormat": "YYYY-MM-DD HH:mm:ss",
"pattern": "table_name.keyword",
"type": "string"
},
{
"alias": "Index",
"align": "auto",
"colorMode": "value",
"colors": [
"rgba(50, 172, 45, 0.97)",
"rgba(237, 129, 40, 0.89)",
"rgba(245, 54, 54, 0.9)"
],
"decimals": 2,
"pattern": "index_name.keyword",
"thresholds": [
"60",
"80",
"90"
],
"type": "string",
"unit": "percent"
},
{
"alias": "Scans",
"align": "auto",
"colorMode": null,
"colors": [
"rgba(245, 54, 54, 0.9)",
"rgba(237, 129, 40, 0.89)",
"rgba(50, 172, 45, 0.97)"
],
"dateFormat": "YYYY-MM-DD HH:mm:ss",
"decimals": 0,
"mappingType": 1,
"pattern": "Average user_scans",
"sanitize": false,
"thresholds": [],
"type": "number",
"unit": "none"
},
{
"alias": "Seeks",
"align": "auto",
"colorMode": null,
"colors": [
"rgba(245, 54, 54, 0.9)",
"rgba(237, 129, 40, 0.89)",
"rgba(50, 172, 45, 0.97)"
],
"dateFormat": "YYYY-MM-DD HH:mm:ss",
"decimals": 0,
"mappingType": 1,
"pattern": "Average user_seeks",
"thresholds": [],
"type": "number",
"unit": "none"
},
{
"alias": "Lookups",
"align": "auto",
"colorMode": null,
"colors": [
"rgba(245, 54, 54, 0.9)",
"rgba(237, 129, 40, 0.89)",
"rgba(50, 172, 45, 0.97)"
],
"dateFormat": "YYYY-MM-DD HH:mm:ss",
"decimals": 0,
"mappingType": 1,
"pattern": "Average user_lookups",
"thresholds": [],
"type": "number",
"unit": "none"
},
{
"alias": "Updates",
"align": "auto",
"colorMode": null,
"colors": [
"rgba(245, 54, 54, 0.9)",
"rgba(237, 129, 40, 0.89)",
"rgba(50, 172, 45, 0.97)"
],
"dateFormat": "YYYY-MM-DD HH:mm:ss",
"decimals": 0,
"mappingType": 1,
"pattern": "Average user_updates",
"thresholds": [],
"type": "number",
"unit": "none"
},
{
"alias": "Total index usages",
"align": "auto",
"colorMode": null,
"colors": [
"rgba(245, 54, 54, 0.9)",
"rgba(237, 129, 40, 0.89)",
"rgba(50, 172, 45, 0.97)"
],
"dateFormat": "YYYY-MM-DD HH:mm:ss",
"decimals": 0,
"mappingType": 1,
"pattern": "bucket",
"thresholds": [],
"type": "number",
"unit": "none"
}
],
"targets": [
{
"alias": "",
"bucketAggs": [
{
"fake": true,
"field": "table_name.keyword",
"id": "4",
"settings": {
"min_doc_count": 1,
"order": "desc",
"orderBy": "9",
"size": "0"
},
"type": "terms"
},
{
"fake": true,
"field": "index_name.keyword",
"id": "3",
"settings": {
"min_doc_count": 1,
"order": "desc",
"orderBy": "9",
"size": "0"
},
"type": "terms"
}
],
"hide": true,
"metrics": [
{
"field": "user_scans",
"id": "5",
"meta": {},
"settings": {},
"type": "avg"
},
{
"field": "user_seeks",
"id": "6",
"meta": {},
"settings": {},
"type": "avg"
},
{
"field": "user_lookups",
"id": "7",
"meta": {},
"settings": {},
"type": "avg"
},
{
"field": "user_updates",
"id": "8",
"meta": {},
"settings": {},
"type": "avg"
},
{
"field": "select field",
"id": "9",
"meta": {},
"pipelineVariables": [
{
"name": "var1",
"pipelineAgg": "5"
},
{
"name": "var2",
"pipelineAgg": "6"
},
{
"name": "var3",
"pipelineAgg": "7"
}
],
"settings": {
"script": "params.var1+params.var2+params.var3"
},
"type": "bucket_script"
}
],
"query": "database_name.keyword:$Database",
"refId": "A",
"timeField": "@timestamp"
},
{
"bucketAggs": [
{
"fake": true,
"field": "table_name.keyword",
"id": "3",
"settings": {
"min_doc_count": 1,
"order": "desc",
"orderBy": "4",
"size": "0"
},
"type": "terms"
},
{
"fake": true,
"field": "index_name.keyword",
"id": "9",
"settings": {
"min_doc_count": 1,
"order": "desc",
"orderBy": "4",
"size": "10"
},
"type": "terms"
}
],
"metrics": [
{
"field": "user_scans",
"id": "4",
"meta": {},
"settings": {},
"type": "avg"
},
{
"field": "user_seeks",
"id": "5",
"meta": {},
"settings": {},
"type": "avg"
},
{
"field": "user_lookups",
"id": "6",
"meta": {},
"settings": {},
"type": "avg"
},
{
"field": "user_updates",
"id": "7",
"meta": {},
"settings": {},
"type": "avg"
}
],
"query": "database_name.keyword:$Database",
"refId": "B",
"timeField": "@timestamp"
}
],
"timeFrom": null,
"timeShift": null,
"title": "Index usage - $Database",
"transform": "table",
"type": "table"
},
{
"collapsed": false,
"datasource": null,
"gridPos": {
"h": 1,
"w": 24,
"x": 0,
"y": 6
},
"id": 76,
"panels": [],
"title": "Underutilised indexes",
"type": "row"
},
{
"cacheTimeout": null,
"columns": [],
"datasource": "Elasticsearch [index-stats]",
"fontSize": "100%",
"gridPos": {
"h": 7,
"w": 24,
"x": 0,
"y": 7
},
"id": 58,
"links": [],
"options": {},
"pageSize": null,
"repeat": "Database",
"repeatDirection": "h",
"scopedVars": {
"Database": {
"selected": true,
"text": "",
"value": ""
}
},
"showHeader": true,
"sort": {
"col": 3,
"desc": true
},
"styles": [
{
"alias": "Table",
"align": "auto",
"dateFormat": "YYYY-MM-DD HH:mm:ss",
"pattern": "table_name.keyword",
"type": "string"
},
{
"alias": "Index",
"align": "auto",
"colorMode": null,
"colors": [
"rgba(245, 54, 54, 0.9)",
"rgba(237, 129, 40, 0.89)",
"rgba(50, 172, 45, 0.97)"
],
"decimals": 2,
"pattern": "index_name.keyword",
"thresholds": [],
"type": "string",
"unit": "short"
},
{
"alias": "Lookups",
"align": "auto",
"colorMode": null,
"colors": [
"rgba(245, 54, 54, 0.9)",
"rgba(237, 129, 40, 0.89)",
"rgba(50, 172, 45, 0.97)"
],
"dateFormat": "YYYY-MM-DD HH:mm:ss",
"decimals": 0,
"mappingType": 1,
"pattern": "Average user_lookups",
"thresholds": [],
"type": "number",
"unit": "short"
},
{
"alias": "Scans",
"align": "auto",
"colorMode": null,
"colors": [
"rgba(245, 54, 54, 0.9)",
"rgba(237, 129, 40, 0.89)",
"rgba(50, 172, 45, 0.97)"
],
"dateFormat": "YYYY-MM-DD HH:mm:ss",
"decimals": 0,
"mappingType": 1,
"pattern": "Average user_scans",
"thresholds": [],
"type": "number",
"unit": "short"
},
{
"alias": "Seeks",
"align": "auto",
"colorMode": null,
"colors": [
"rgba(245, 54, 54, 0.9)",
"rgba(237, 129, 40, 0.89)",
"rgba(50, 172, 45, 0.97)"
],
"dateFormat": "YYYY-MM-DD HH:mm:ss",
"decimals": 0,
"mappingType": 1,
"pattern": "Average user_seeks",
"thresholds": [],
"type": "number",
"unit": "short"
},
{
"alias": "Total Usage",
"align": "auto",
"colorMode": null,
"colors": [
"rgba(245, 54, 54, 0.9)",
"rgba(237, 129, 40, 0.89)",
"rgba(50, 172, 45, 0.97)"
],
"dateFormat": "YYYY-MM-DD HH:mm:ss",
"decimals": 3,
"mappingType": 1,
"pattern": "Bucket Script",
"thresholds": [],
"type": "number",
"unit": "short"
},
{
"alias": "Updates",
"align": "auto",
"colorMode": null,
"colors": [
"rgba(245, 54, 54, 0.9)",
"rgba(237, 129, 40, 0.89)",
"rgba(50, 172, 45, 0.97)"
],
"dateFormat": "YYYY-MM-DD HH:mm:ss",
"decimals": 0,
"mappingType": 1,
"pattern": "Average user_updates",
"thresholds": [],
"type": "number",
"unit": "short"
}
],
"targets": [
{
"alias": "{{table_name.keyword}}.{{index_name.keyword}}",
"bucketAggs": [
{
"fake": true,
"field": "table_name.keyword",
"id": "5",
"settings": {
"min_doc_count": 1,
"order": "desc",
"orderBy": "6",
"size": "5"
},
"type": "terms"
},
{
"fake": true,
"field": "index_name.keyword",
"id": "3",
"settings": {
"min_doc_count": 1,
"order": "desc",
"orderBy": "6",
"size": "10"
},
"type": "terms"
}
],
"metrics": [
{
"field": "user_lookups",
"hide": true,
"id": "1",
"meta": {},
"settings": {},
"type": "avg"
},
{
"field": "user_scans",
"hide": true,
"id": "6",
"meta": {},
"settings": {},
"type": "avg"
},
{
"field": "user_seeks",
"hide": true,
"id": "7",
"meta": {},
"settings": {},
"type": "avg"
},
{
"field": "select field",
"id": "8",
"meta": {},
"pipelineVariables": [
{
"name": "var1",
"pipelineAgg": "1"
},
{
"name": "var2",
"pipelineAgg": "6"
},
{
"name": "var3",
"pipelineAgg": "7"
},
{
"name": "var4",
"pipelineAgg": "9"
}
],
"settings": {
"script": "params.var4/(params.var1+params.var2+params.var3)"
},
"type": "bucket_script"
},
{
"field": "user_updates",
"hide": true,
"id": "9",
"meta": {},
"settings": {},
"type": "avg"
}
],
"query": "database_name.keyword:$Database AND user_lookups:[0 TO 100] AND user_scans:[0 TO 100] AND user_seeks:[0 TO 100]",
"refId": "A",
"timeField": "@timestamp"
}
],
"timeFrom": null,
"timeShift": null,
"title": "$Database - Underutilised indexes",
"transform": "table",
"type": "table"
},
{
"collapsed": false,
"datasource": null,
"gridPos": {
"h": 1,
"w": 24,
"x": 0,
"y": 14
},
"id": 91,
"panels": [],
"title": "Missing Indexes",
"type": "row"
},
{
"columns": [],
"datasource": "Elasticsearch [missing-indexes]",
"fontSize": "100%",
"gridPos": {
"h": 5,
"w": 24,
"x": 0,
"y": 15
},
"id": 89,
"interval": "30m",
"links": [],
"maxPerRow": 2,
"options": {},
"pageSize": null,
"repeat": "Database",
"repeatDirection": "v",
"scopedVars": {
"Database": {
"selected": true,
"text": "",
"value": ""
}
},
"scroll": true,
"showHeader": true,
"sort": {
"col": 6,
"desc": true
},
"styles": [
{
"alias": "Table",
"align": "auto",
"dateFormat": "YYYY-MM-DD HH:mm:ss",
"pattern": "table_name.keyword",
"type": "string"
},
{
"alias": "Index",
"align": "auto",
"colorMode": "value",
"colors": [
"rgba(50, 172, 45, 0.97)",
"rgba(237, 129, 40, 0.89)",
"rgba(245, 54, 54, 0.9)"
],
"decimals": 2,
"pattern": "sql_code.keyword",
"thresholds": [
""
],
"type": "string",
"unit": "percent"
},
{
"alias": "Impact",
"align": "auto",
"colorMode": null,
"colors": [
"rgba(245, 54, 54, 0.9)",
"rgba(237, 129, 40, 0.89)",
"rgba(50, 172, 45, 0.97)"
],
"dateFormat": "YYYY-MM-DD HH:mm:ss",
"decimals": 2,
"mappingType": 1,
"pattern": "Average",
"sanitize": false,
"thresholds": [],
"type": "number",
"unit": "none"
},
{
"alias": "Seeks",
"align": "auto",
"colorMode": null,
"colors": [
"rgba(245, 54, 54, 0.9)",
"rgba(237, 129, 40, 0.89)",
"rgba(50, 172, 45, 0.97)"
],
"dateFormat": "YYYY-MM-DD HH:mm:ss",
"decimals": 0,
"mappingType": 1,
"pattern": "Average user_seeks",
"thresholds": [],
"type": "number",
"unit": "none"
}
],
"targets": [
{
"alias": "",
"bucketAggs": [
{
"fake": true,
"field": "table_name.keyword",
"id": "11",
"settings": {
"min_doc_count": 1,
"order": "desc",
"orderBy": "10",
"size": "0"
},
"type": "terms"
},
{
"fake": true,
"field": "sql_code.keyword",
"id": "4",
"settings": {
"min_doc_count": 1,
"order": "desc",
"orderBy": "10",
"size": "0"
},
"type": "terms"
}
],
"metrics": [
{
"field": "overall_impact",
"id": "10",
"meta": {},
"settings": {},
"type": "avg"
}
],
"query": "database_name.keyword:$Database",
"refId": "A",
"timeField": "@timestamp"
}
],
"timeFrom": null,
"timeShift": null,
"title": "Missing indexes - $Database",
"transform": "table",
"type": "table"
}
],
"refresh": false,
"schemaVersion": 22,
"style": "dark",
"tags": [],
"templating": {
"list": [
{
"allValue": null,
"current": {
"text": "",
"value": [
""
]
},
"datasource": "Elasticsearch [index-stats]",
"definition": "{\"find\": \"terms\",\"field\": \"database_name.keyword\"}",
"hide": 0,
"includeAll": true,
"label": null,
"multi": true,
"name": "Database",
"options": [],
"query": "{\"find\": \"terms\",\"field\": \"database_name.keyword\"}",
"refresh": 2,
"regex": "",
"skipUrlSync": false,
"sort": 0,
"tagValuesQuery": "",
"tags": [],
"tagsQuery": "",
"type": "query",
"useTags": false
}
]
},
"time": {
"from": "now-24h",
"to": "now"
},
"timepicker": {
"refresh_intervals": [
"5s",
"10s",
"30s",
"1m",
"5m",
"15m",
"30m",
"1h",
"2h",
"1d"
],
"time_options": [
"5m",
"15m",
"1h",
"6h",
"12h",
"24h",
"2d",
"7d",
"30d"
]
},
"timezone": "",
"title": "Index Maintenance",
"uid": "OQVK9BSWk",
"version": 27
}