Writing Prometheus exporters – the Lazy Dev way

This article is part of the C# Advent Series. Christmas has a special place in our hearts and this event is also a wonderful way to help build up the C# community. Do check out awesome content from other authors!

There’s a couple of things about Christmas in Southern Hemisphere that tends to hit us pretty hard each year: first, the fact that it is summer and it’s scorching hot outside. And second – is a customary closedown of almost all businesses (which probably started as response to the first point). Some businesses, however, keep boxing on.

One of our clients is into cryptocurrency mining and they could not care less about staff wanting time off to spend with family. Their only workforce are GPUs, and these devices can work 24/7. However, with temperatures creeping up, efficiency takes a hit. Also, other sad things can happen:

Solution design

Our first suggestion was to use our trusty ELK+G and poll extra data from NVIDIA SMI tool, but we soon figured out that this problem has already been solved for us. Mining software nowadays got extremely sophisticated (and obfuscated) – it now comes with own webserver and API. So, we simplified a bit:

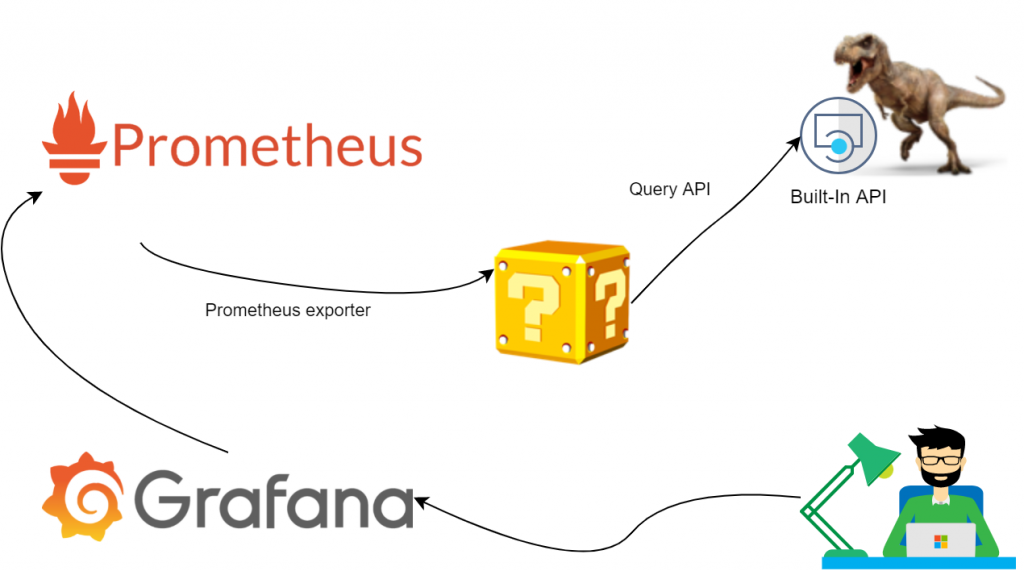
All we have to do here would be to stand up an exporter and set up a few dashboards. Easy.

Hosted Services

We essentially need to run two services: poll underlying API and expose metrics in Prometheus-friendly format. We felt .NET Core Generic host infrastructure would fit very well here. It allows us to bootstrap an app, add Hosted Services and leave plumbing to Docker. The program ended up looking like so:

class Program
    {
        private static async Task Main(string[] args)
        {
            using IHost host = CreatHostBuilder(args).Build();
            
            await host.RunAsync();
        }
        static IHostBuilder CreateHostBuilder(string[] args) =>
            Host.CreateDefaultBuilder(args)
                .ConfigureAppConfiguration((configuration) =>
                {
                    configuration.AddEnvironmentVariables("TREX")
; // can add more sources such as command line
                })
                .ConfigureServices(c =>
                {
                    c.AddSingleton<MetricCollection>(); // This is where we will keep all metrics state. hence singleton
                    c.AddHostedService<PrometheusExporter>(); // exposes MetricCollection
                    c.AddHostedService<TRexPoller>(); // periodically GETs status and updates MetricCollection
                });
    }

Defining services

The two parts of our applicatgion are TRexPoller and PrometheusExporter. Writing both is trivial and we won’t spend much time on the code there. Feel free to check it out on GitHub. The point to make here is it has never been easier to focus on business logic and leave heavy lifting to respective NuGet packages.

Crafting the models

The most important part of our application is of course telemetry. We grabbed a sample json response from the API and used an online tool to convert that into C# classes:

// generated code looks like this. A set of POCOs with each property decorated with JsonProperty that maps to api response
public partial class Gpu
{
    [JsonProperty("device_id")]
    public int DeviceId { get; set; }
    [JsonProperty("hashrate")]
    public int Hashrate { get; set; }
    [JsonProperty("hashrate_day")]
    public int HashrateDay { get; set; }
    [JsonProperty("hashrate_hour")]
    public int HashrateHour { get; set; }
...
}

Now we need to define metrics that Prometheus.Net can later discover and serve up:

// example taken from https://github.com/prometheus-net/prometheus-net#quick-start
private static readonly Counter ProcessedJobCount = Metrics
    .CreateCounter("myapp_jobs_processed_total", "Number of processed jobs.");
...
ProcessJob();
ProcessedJobCount.Inc();

Turning on lazy mode

This is where we’ve got so inspired by our “low code” solution that we didn’t want to get down to hand-crafting a bunch of class fields to describe every single value the API serves. Luckily, C#9 has a new feature just for us: Source Code Generators to the rescue! We’ve covered the basic setup before, so we’ll skip this part here and move on to the Christmas magic part.

Let Code Generators do the work for us

Before we hand everything over to robots, we need to set some basic rules to control the process. Custom attributes looked like a sensible way to keep all configuration local with the model POCOs:

[AddInstrumentation("gpus")] // the first attribute prompts the generator to loop through the properties and search for metrics 
public partial class Gpu
{
    [JsonProperty("device_id")]
    public int DeviceId { get; set; }
    [JsonProperty("hashrate")]
    /*
     * the second attribute controls which type the metric will have as well as what labels we want to store with it.
     * In this example, it's a Gauge with gpu_id, vendor and name being labels for grouping in Prometheus
     */
    [Metric("Gauge", "gpu_id", "vendor", "name")]
    public int Hashrate { get; set; }
    [JsonProperty("hashrate_day")]
    [Metric("Gauge", "gpu_id", "vendor", "name")]
    public int HashrateDay { get; set; }
    [JsonProperty("hashrate_hour")]
    [Metric("Gauge", "gpu_id", "vendor", "name")]
    public int HashrateHour { get; set; }

Finally, the generator itself hooks into ClassDeclarationSyntax and looks for well-known attributes:

public void OnVisitSyntaxNode(SyntaxNode syntaxNode)
    {
        if (syntaxNode is ClassDeclarationSyntax cds && cds.AttributeLists
            .SelectMany(al => al.Attributes)
            .Any(a => (a.Name as IdentifierNameSyntax)?.Identifier.ValueText == "AddInstrumentation"))
        {
            ClassesToProcess.Add(cds);
        }
    }

Once we’ve got our list, we loop through each property and generate a dictionary of Collector objects.

var text = new StringBuilder(@"public static Dictionary<string, Collector> GetMetrics(string prefix)
    {
        var result = new Dictionary<string, Collector>
        {").AppendLine();
foreach (PropertyDeclarationSyntax p in properties)
{
    var jsonPropertyAttr = p.GetAttr("JsonProperty");
    var metricAttr = p.GetAttr("Metric");
    if (metricAttr == null) continue;
    var propName = jsonPropertyAttr.GetFirstParameterValue();
    var metricName = metricAttr.GetFirstParameterValue(); // determine metric type
    if (metricAttr.ArgumentList.Arguments.Count > 1)
    {
        var labels = metricAttr.GetTailParameterValues(); // if we have extra labels to process - here's our chance 
        text.AppendLine(
            $"{{$\"{{prefix}}{attrPrefix}_{propName}\", Metrics.Create{metricName}($\"{{prefix}}{attrPrefix}_{propName}\", \"{propName}\", {commonLabels}, {labels}) }},");
    }
    else
    {
        text.AppendLine(
            $"{{$\"{{prefix}}{attrPrefix}_{propName}\", Metrics.Create{metricName}($\"{{prefix}}{attrPrefix}_{propName}\", \"{propName}\", {commonLabels}) }},");
    }
}
text.AppendLine(@"};
                return result;
            }");

In parallel to defining storage for metrics, we also need to generate code that will update values as soon as we’ve heard back from the API:

private StringBuilder UpdateMetrics(List<MemberDeclarationSyntax> properties, SyntaxToken classToProcess, string attrPrefix)
{
    var text = new StringBuilder($"public static void UpdateMetrics(string prefix, Dictionary<string, Collector> metrics, {classToProcess} data, string host, string slot, string algo, List<string> extraLabels = null) {{");
    text.AppendLine();
    text.AppendLine(@"if(extraLabels == null) { 
                            extraLabels = new List<string> {host, slot, algo};
                        }
                        else {
                            extraLabels.Insert(0, algo);
                            extraLabels.Insert(0, slot);
                            extraLabels.Insert(0, host);
                        }");
    foreach (PropertyDeclarationSyntax p in properties)
    {
        var jsonPropertyAttr = p.GetAttr("JsonProperty");
        var metricAttr = p.GetAttr("Metric");
        if (metricAttr == null) continue;
        var propName = jsonPropertyAttr.GetFirstParameterValue();
        var metricName = metricAttr.GetFirstParameterValue();
        var newValue = $"data.{p.Identifier.ValueText}";
        text.Append(
            $"(metrics[$\"{{prefix}}{attrPrefix}_{propName}\"] as {metricName}).WithLabels(extraLabels.ToArray())");
        switch (metricName)
        {
            case "Counter": text.AppendLine($".IncTo({newValue});"); break;
            case "Gauge": text.AppendLine($".Set({newValue});"); break;
        }
    }
    text.AppendLine("}").AppendLine();
    return text;
}

Bringing it all together with MetricCollection

Finally, we can use the generated code to bootstrap metrics on per-model basis and ensure we correctly handle updates:

internal class MetricCollection
{
    private readonly Dictionary<string, Collector> _metrics;
    private readonly string _prefix;
    private readonly string _host;
    public MetricCollection(IConfiguration configuration)
    {
        _prefix = configuration.GetValue<string>("exporterPrefix", "trex");
        _metrics = new Dictionary<string, Collector>();
        // this is where declaring particl classes and generating extra methods makes for seamless development experience
        foreach (var (key, value) in TRexResponse.GetMetrics(_prefix)) _metrics.Add(key, value);
        foreach (var (key, value) in DualStat.GetMetrics(_prefix)) _metrics.Add(key, value);
        foreach (var (key, value) in Gpu.GetMetrics(_prefix)) _metrics.Add(key, value);
        foreach (var (key, value) in Shares.GetMetrics(_prefix)) _metrics.Add(key, value);
    }
    public void Update(TRexResponse data)
    {
        TRexResponse.UpdateMetrics(_prefix, _metrics, data, _host, "main", data.Algorithm);
        DualStat.UpdateMetrics(_prefix, _metrics, data.DualStat, _host, "dual", data.DualStat.Algorithm);
        
        foreach (var dataGpu in data.Gpus)
        {
            Gpu.UpdateMetrics(_prefix, _metrics, dataGpu, _host, "main", data.Algorithm, new List<string>
            {
                dataGpu.DeviceId.ToString(),
                dataGpu.Vendor,
                dataGpu.Name
            });
            Shares.UpdateMetrics(_prefix, _metrics, dataGpu.Shares, _host, "main", data.Algorithm, new List<string>
            {
                dataGpu.GpuId.ToString(),
                dataGpu.Vendor,
                dataGpu.Name
            });
        }
    }
}

Peeking into generated code

Just to make sure we’re on the right track, we looked at generated code. It ain’t pretty but it’s honest work:

public partial class Shares {
public static Dictionary<string, Collector> GetMetrics(string prefix)
                {
                    var result = new Dictionary<string, Collector>
                    {
{$"{prefix}_shares_accepted_count", Metrics.CreateCounter($"{prefix}_shares_accepted_count", "accepted_count", "host", "slot", "algo", "gpu_id", "vendor", "name") },
{$"{prefix}_shares_invalid_count", Metrics.CreateCounter($"{prefix}_shares_invalid_count", "invalid_count", "host", "slot", "algo", "gpu_id", "vendor", "name") },
{$"{prefix}_shares_last_share_diff", Metrics.CreateGauge($"{prefix}_shares_last_share_diff", "last_share_diff", "host", "slot", "algo", "gpu_id", "vendor", "name") },
...
};
                            return result;
                        }
public static void UpdateMetrics(string prefix, Dictionary<string, Collector> metrics, Shares data, string host, string slot, string algo, List<string> extraLabels = null) {
if(extraLabels == null) { 
                                    extraLabels = new List<string> {host, slot, algo};
                                }
                                else {
                                    extraLabels.Insert(0, algo);
                                    extraLabels.Insert(0, slot);
                                    extraLabels.Insert(0, host);
                                }
(metrics[$"{prefix}_shares_accepted_count"] as Counter).WithLabels(extraLabels.ToArray()).IncTo(data.AcceptedCount);
(metrics[$"{prefix}_shares_invalid_count"] as Counter).WithLabels(extraLabels.ToArray()).IncTo(data.InvalidCount);
(metrics[$"{prefix}_shares_last_share_diff"] as Gauge).WithLabels(extraLabels.ToArray()).Set(data.LastShareDiff);
...
}
}

Conclusion

This example barely scratches the surface of what’s possible with this feature. Source code generators are extremely helpful when we deal with tedious and repetitive development tasks. It also helps reduce maintenance overheads by enabling us to switch to declarative approach. I’m sure we will see more projects coming up where this feature will become central to the solution.

If not already, do check out the source code in GitHub. And as for us, we would like to sign off with warmest greetings of this festive season and best wishes for happiness in the New Year.

Monitoring SQL Server: index maintenance

Now that we’ve got basic SQL queries going, we want to collect some actionable intel. A good measure of any SQL database performance is how well indexes are utilised.

This isn’t new

All queries we’re about to share are hardly a revelation. What we however want to achieve is to have an idea of how that information changes over time

Index utilisation

input {
	############################################################# Index Maintenance ############################################################################
	jdbc {
		id => "master_index_maintenance"
		jdbc_driver_library => "path\to\jdbc\lib\mssql-jdbc-7.2.1.jre8.jar"
		jdbc_driver_class => "com.microsoft.sqlserver.jdbc.SQLServerDriver"
		jdbc_connection_string => "jdbc:sqlserver://<your connection string>"
		jdbc_user => nil
		schedule => "*/15 * * * *"
		statement => "	DECLARE @db_id INT
						DECLARE @db_name NVARCHAR(120)
						DECLARE @index_data TABLE(
												[database_name] NVARCHAR(128) NOT NULL,
												table_name sysname NOT NULL, 
												index_name sysname NULL, 
												index_type TINYINT NOT NULL, 
												user_seeks bigint NOT NULL, 
												user_scans bigint NOT NULL, 
												user_lookups bigint NOT NULL, 
												user_updates bigint NOT NULL
											   );

						SET NOCOUNT ON
						DECLARE @dbs table ([db_name] sysname)
						DECLARE @db_query_sql nvarchar(4000)
						SET @db_query_sql='select ''?'' as [db_name] from [?].sys.tables t WHERE t.name = ''Users''';

						INSERT INTO @dbs ([db_name]) EXEC sp_msforeachdb @db_query_sql
						SET NOCOUNT OFF

						DECLARE db_id_cursor CURSOR FOR SELECT DB_ID([db_name]), [db_name] FROM @dbs FOR READ ONLY 
						OPEN db_id_cursor  
						FETCH NEXT FROM db_id_cursor INTO @db_id, @db_name;  
						WHILE @@FETCH_STATUS = 0  
						BEGIN
							DECLARE @sql NVARCHAR(MAX) = CAST(N'USE [' + @db_name + '];
							
							SELECT ''' + @db_name + ''', t.[name], ix.[name], ix.[type], us.user_seeks, us.user_scans, us.user_lookups, us.user_updates
							FROM sys.dm_db_index_usage_stats us
							INNER JOIN sys.indexes ix ON us.object_id = ix.object_id and ix.index_id = us.index_id
							INNER JOIN sys.tables t ON ix.object_id = t.object_id	
							WHERE us.database_id = ' + CAST(@db_id AS NVARCHAR(10)) AS NVARCHAR(MAX));

							INSERT INTO @index_data EXEC sys.sp_executesql @sql;
							FETCH NEXT FROM db_id_cursor INTO @db_id, @db_name;  
						END
						CLOSE db_id_cursor
						DEALLOCATE db_id_cursor
						SELECT * FROM @index_data"
		add_field => {
						"sql_instance" => "SQL2"
					}
	}
	################################################################################################################################################################	
}
output {
	elasticsearch {
		hosts => "elasticsearch:9200"
		index => "sql-index-stats-%{+YYYY.MM}"            
	}
}

Missing indexes

This one is a bit more interesing in a sense that we will get actual index hints. It is not a silver bullet though – this still needs to be analysed by humans for best results.

input {
	############################################################# Master sp_WhoIsActive ############################################################################
	jdbc {
		id => "master_missing_indexes"
		jdbc_driver_library => "path\to\jdbc\lib\mssql-jdbc-7.2.1.jre8.jar"
		jdbc_driver_class => "com.microsoft.sqlserver.jdbc.SQLServerDriver"
		jdbc_connection_string => "jdbc:sqlserver://<your connection string>"
		jdbc_user => nil
		schedule => "1 */2 * * *"
		statement => "	DECLARE @db_id INT
						DECLARE @db_name NVARCHAR(120)
						DECLARE @index_data TABLE(
												[database_name] NVARCHAR(128) NOT NULL,						
												table_name sysname NOT NULL, 
												unique_compiles bigint NOT NULL,
												user_seeks bigint NOT NULL, 
												user_scans bigint NOT NULL, 
												avg_total_user_cost float NULL, 
												avg_user_impact float NULL, 
												overall_impact float NOT NULL,
												sql_code NVARCHAR(MAX) NOT NULL
											   );

						SET NOCOUNT ON
						DECLARE @dbs table ([db_name] sysname)
						DECLARE @db_query_sql nvarchar(4000)
						SET @db_query_sql='select ''?'' as [db_name] from [?].sys.tables t WHERE t.name = ''Users''';

						INSERT INTO @dbs ([db_name]) EXEC sp_msforeachdb @db_query_sql
						SET NOCOUNT OFF

						DECLARE db_id_cursor CURSOR FOR SELECT DB_ID([db_name]), [db_name] FROM @dbs FOR READ ONLY 
						OPEN db_id_cursor  
						FETCH NEXT FROM db_id_cursor INTO @db_id, @db_name;  
						WHILE @@FETCH_STATUS = 0  
						BEGIN
							DECLARE @sql NVARCHAR(MAX) = CAST(N'USE [' + @db_name + '];
							
							WITH index_definitions (table_name, unique_compiles, user_seeks, users_scans, avg_total_user_cost, 
							avg_user_impact, [overall_impact], column_names, included_columns) 
							AS (
								SELECT TOP(600) object_name(c.object_id) AS table_name, 
								a.unique_compiles, a.user_seeks, a.user_scans, a.avg_total_user_cost, a.avg_user_impact, 
								a.avg_total_user_cost * a.avg_user_impact * (a.user_seeks + a.user_scans) AS [overall_impact],
								case when c.equality_columns is not null and c.inequality_columns is not null then c.equality_columns + '', '' + c.inequality_columns
								when c.equality_columns is not null and c.inequality_columns is null then c.equality_columns
								when c.inequality_columns is not null then c.inequality_columns
								END AS column_names,
								c.included_columns
								FROM sys.dm_db_missing_index_group_stats a
								inner join sys.dm_db_missing_index_groups b ON a.group_handle = b.index_group_handle
								inner join sys.dm_db_missing_index_details c on c.index_handle = b.index_handle
								where database_id = ' + CAST(@db_id AS NVARCHAR(10)) + '
								and equality_columns is not null
							)
							SELECT '''+ @db_name +''' AS [database], table_name, unique_compiles, user_seeks, users_scans, avg_total_user_cost, avg_user_impact, overall_impact, ''CREATE NONCLUSTERED INDEX IX_'' + REPLACE(REPLACE(REPLACE(index_definitions.column_names, ''], ['', ''_''), ''['', ''''), '']'', '''') 
									+ '' on '' + index_definitions.table_name + '' ('' + index_definitions.column_names + '') INCLUDE ('' + index_definitions.included_columns + '')''  AS [sql_code]
							FROM index_definitions WHERE index_definitions.included_columns IS NOT NULL
							UNION 
							SELECT '''+ @db_name +''' AS [database], table_name, unique_compiles, user_seeks, users_scans, avg_total_user_cost, avg_user_impact, overall_impact, ''CREATE NONCLUSTERED INDEX IX_'' + REPLACE(REPLACE(REPLACE(index_definitions.column_names, ''], ['', ''_''), ''['', ''''), '']'', '''') 
									+ '' on '' + index_definitions.table_name + '' ('' + index_definitions.column_names + '')'' AS [sql_code]
							FROM index_definitions WHERE index_definitions.included_columns IS NULL' AS NVARCHAR(MAX));

							INSERT INTO @index_data EXEC sys.sp_executesql @sql;
							FETCH NEXT FROM db_id_cursor INTO @db_id, @db_name;  
						END
						CLOSE db_id_cursor
						DEALLOCATE db_id_cursor
						SELECT * FROM @index_data;"
		add_field => {
						"sql_instance" => "SQL2"
					}
	}
	################################################################################################################################################################	
}
output {
	elasticsearch {
		hosts => "elasticsearch:9200"
		index => "sql-missing-indexes-%{+YYYY.MM}"            
	}
}

With data collection out of the way it’s time to move on to plotting graphs. Grafana is quite easy to pick up so instead of repeating official documentation we’d share a few dashboards we have in place

{
  "annotations": {
    "list": [
      {
        "builtIn": 1,
        "datasource": "-- Grafana --",
        "enable": true,
        "hide": true,
        "iconColor": "rgba(0, 211, 255, 1)",
        "name": "Annotations & Alerts",
        "type": "dashboard"
      }
    ]
  },
  "editable": true,
  "gnetId": null,
  "graphTooltip": 0,
  "id": 33,
  "iteration": 1584410507264,
  "links": [],
  "panels": [
    {
      "collapsed": false,
      "datasource": null,
      "gridPos": {
        "h": 1,
        "w": 24,
        "x": 0,
        "y": 0
      },
      "id": 74,
      "panels": [],
      "title": "Index usage",
      "type": "row"
    },
    {
      "columns": [],
      "datasource": "Elasticsearch [index-stats]",
      "fontSize": "100%",
      "gridPos": {
        "h": 5,
        "w": 24,
        "x": 0,
        "y": 1
      },
      "id": 72,
      "interval": "1h",
      "links": [],
      "maxPerRow": null,
      "options": {},
      "pageSize": null,
      "repeat": "Database",
      "repeatDirection": "v",
      "scopedVars": {
        "Database": {
          "selected": true,
          "text": "All",
          "value": "All"
        }
      },
      "scroll": true,
      "showHeader": true,
      "sort": {
        "col": 4,
        "desc": true
      },
      "styles": [
        {
          "alias": "Table",
          "align": "auto",
          "dateFormat": "YYYY-MM-DD HH:mm:ss",
          "pattern": "table_name.keyword",
          "type": "string"
        },
        {
          "alias": "Index",
          "align": "auto",
          "colorMode": "value",
          "colors": [
            "rgba(50, 172, 45, 0.97)",
            "rgba(237, 129, 40, 0.89)",
            "rgba(245, 54, 54, 0.9)"
          ],
          "decimals": 2,
          "pattern": "index_name.keyword",
          "thresholds": [
            "60",
            "80",
            "90"
          ],
          "type": "string",
          "unit": "percent"
        },
        {
          "alias": "Scans",
          "align": "auto",
          "colorMode": null,
          "colors": [
            "rgba(245, 54, 54, 0.9)",
            "rgba(237, 129, 40, 0.89)",
            "rgba(50, 172, 45, 0.97)"
          ],
          "dateFormat": "YYYY-MM-DD HH:mm:ss",
          "decimals": 0,
          "mappingType": 1,
          "pattern": "Average user_scans",
          "sanitize": false,
          "thresholds": [],
          "type": "number",
          "unit": "none"
        },
        {
          "alias": "Seeks",
          "align": "auto",
          "colorMode": null,
          "colors": [
            "rgba(245, 54, 54, 0.9)",
            "rgba(237, 129, 40, 0.89)",
            "rgba(50, 172, 45, 0.97)"
          ],
          "dateFormat": "YYYY-MM-DD HH:mm:ss",
          "decimals": 0,
          "mappingType": 1,
          "pattern": "Average user_seeks",
          "thresholds": [],
          "type": "number",
          "unit": "none"
        },
        {
          "alias": "Lookups",
          "align": "auto",
          "colorMode": null,
          "colors": [
            "rgba(245, 54, 54, 0.9)",
            "rgba(237, 129, 40, 0.89)",
            "rgba(50, 172, 45, 0.97)"
          ],
          "dateFormat": "YYYY-MM-DD HH:mm:ss",
          "decimals": 0,
          "mappingType": 1,
          "pattern": "Average user_lookups",
          "thresholds": [],
          "type": "number",
          "unit": "none"
        },
        {
          "alias": "Updates",
          "align": "auto",
          "colorMode": null,
          "colors": [
            "rgba(245, 54, 54, 0.9)",
            "rgba(237, 129, 40, 0.89)",
            "rgba(50, 172, 45, 0.97)"
          ],
          "dateFormat": "YYYY-MM-DD HH:mm:ss",
          "decimals": 0,
          "mappingType": 1,
          "pattern": "Average user_updates",
          "thresholds": [],
          "type": "number",
          "unit": "none"
        },
        {
          "alias": "Total index usages",
          "align": "auto",
          "colorMode": null,
          "colors": [
            "rgba(245, 54, 54, 0.9)",
            "rgba(237, 129, 40, 0.89)",
            "rgba(50, 172, 45, 0.97)"
          ],
          "dateFormat": "YYYY-MM-DD HH:mm:ss",
          "decimals": 0,
          "mappingType": 1,
          "pattern": "bucket",
          "thresholds": [],
          "type": "number",
          "unit": "none"
        }
      ],
      "targets": [
        {
          "alias": "",
          "bucketAggs": [
            {
              "fake": true,
              "field": "table_name.keyword",
              "id": "4",
              "settings": {
                "min_doc_count": 1,
                "order": "desc",
                "orderBy": "9",
                "size": "0"
              },
              "type": "terms"
            },
            {
              "fake": true,
              "field": "index_name.keyword",
              "id": "3",
              "settings": {
                "min_doc_count": 1,
                "order": "desc",
                "orderBy": "9",
                "size": "0"
              },
              "type": "terms"
            }
          ],
          "hide": true,
          "metrics": [
            {
              "field": "user_scans",
              "id": "5",
              "meta": {},
              "settings": {},
              "type": "avg"
            },
            {
              "field": "user_seeks",
              "id": "6",
              "meta": {},
              "settings": {},
              "type": "avg"
            },
            {
              "field": "user_lookups",
              "id": "7",
              "meta": {},
              "settings": {},
              "type": "avg"
            },
            {
              "field": "user_updates",
              "id": "8",
              "meta": {},
              "settings": {},
              "type": "avg"
            },
            {
              "field": "select field",
              "id": "9",
              "meta": {},
              "pipelineVariables": [
                {
                  "name": "var1",
                  "pipelineAgg": "5"
                },
                {
                  "name": "var2",
                  "pipelineAgg": "6"
                },
                {
                  "name": "var3",
                  "pipelineAgg": "7"
                }
              ],
              "settings": {
                "script": "params.var1+params.var2+params.var3"
              },
              "type": "bucket_script"
            }
          ],
          "query": "database_name.keyword:$Database",
          "refId": "A",
          "timeField": "@timestamp"
        },
        {
          "bucketAggs": [
            {
              "fake": true,
              "field": "table_name.keyword",
              "id": "3",
              "settings": {
                "min_doc_count": 1,
                "order": "desc",
                "orderBy": "4",
                "size": "0"
              },
              "type": "terms"
            },
            {
              "fake": true,
              "field": "index_name.keyword",
              "id": "9",
              "settings": {
                "min_doc_count": 1,
                "order": "desc",
                "orderBy": "4",
                "size": "10"
              },
              "type": "terms"
            }
          ],
          "metrics": [
            {
              "field": "user_scans",
              "id": "4",
              "meta": {},
              "settings": {},
              "type": "avg"
            },
            {
              "field": "user_seeks",
              "id": "5",
              "meta": {},
              "settings": {},
              "type": "avg"
            },
            {
              "field": "user_lookups",
              "id": "6",
              "meta": {},
              "settings": {},
              "type": "avg"
            },
            {
              "field": "user_updates",
              "id": "7",
              "meta": {},
              "settings": {},
              "type": "avg"
            }
          ],
          "query": "database_name.keyword:$Database",
          "refId": "B",
          "timeField": "@timestamp"
        }
      ],
      "timeFrom": null,
      "timeShift": null,
      "title": "Index usage - $Database",
      "transform": "table",
      "type": "table"
    },
    {
      "collapsed": false,
      "datasource": null,
      "gridPos": {
        "h": 1,
        "w": 24,
        "x": 0,
        "y": 6
      },
      "id": 76,
      "panels": [],
      "title": "Underutilised indexes",
      "type": "row"
    },
    {
      "cacheTimeout": null,
      "columns": [],
      "datasource": "Elasticsearch [index-stats]",
      "fontSize": "100%",
      "gridPos": {
        "h": 7,
        "w": 24,
        "x": 0,
        "y": 7
      },
      "id": 58,
      "links": [],
      "options": {},
      "pageSize": null,
      "repeat": "Database",
      "repeatDirection": "h",
      "scopedVars": {
        "Database": {
          "selected": true,
          "text": "",
          "value": ""
        }
      },
      "showHeader": true,
      "sort": {
        "col": 3,
        "desc": true
      },
      "styles": [
        {
          "alias": "Table",
          "align": "auto",
          "dateFormat": "YYYY-MM-DD HH:mm:ss",
          "pattern": "table_name.keyword",
          "type": "string"
        },
        {
          "alias": "Index",
          "align": "auto",
          "colorMode": null,
          "colors": [
            "rgba(245, 54, 54, 0.9)",
            "rgba(237, 129, 40, 0.89)",
            "rgba(50, 172, 45, 0.97)"
          ],
          "decimals": 2,
          "pattern": "index_name.keyword",
          "thresholds": [],
          "type": "string",
          "unit": "short"
        },
        {
          "alias": "Lookups",
          "align": "auto",
          "colorMode": null,
          "colors": [
            "rgba(245, 54, 54, 0.9)",
            "rgba(237, 129, 40, 0.89)",
            "rgba(50, 172, 45, 0.97)"
          ],
          "dateFormat": "YYYY-MM-DD HH:mm:ss",
          "decimals": 0,
          "mappingType": 1,
          "pattern": "Average user_lookups",
          "thresholds": [],
          "type": "number",
          "unit": "short"
        },
        {
          "alias": "Scans",
          "align": "auto",
          "colorMode": null,
          "colors": [
            "rgba(245, 54, 54, 0.9)",
            "rgba(237, 129, 40, 0.89)",
            "rgba(50, 172, 45, 0.97)"
          ],
          "dateFormat": "YYYY-MM-DD HH:mm:ss",
          "decimals": 0,
          "mappingType": 1,
          "pattern": "Average user_scans",
          "thresholds": [],
          "type": "number",
          "unit": "short"
        },
        {
          "alias": "Seeks",
          "align": "auto",
          "colorMode": null,
          "colors": [
            "rgba(245, 54, 54, 0.9)",
            "rgba(237, 129, 40, 0.89)",
            "rgba(50, 172, 45, 0.97)"
          ],
          "dateFormat": "YYYY-MM-DD HH:mm:ss",
          "decimals": 0,
          "mappingType": 1,
          "pattern": "Average user_seeks",
          "thresholds": [],
          "type": "number",
          "unit": "short"
        },
        {
          "alias": "Total Usage",
          "align": "auto",
          "colorMode": null,
          "colors": [
            "rgba(245, 54, 54, 0.9)",
            "rgba(237, 129, 40, 0.89)",
            "rgba(50, 172, 45, 0.97)"
          ],
          "dateFormat": "YYYY-MM-DD HH:mm:ss",
          "decimals": 3,
          "mappingType": 1,
          "pattern": "Bucket Script",
          "thresholds": [],
          "type": "number",
          "unit": "short"
        },
        {
          "alias": "Updates",
          "align": "auto",
          "colorMode": null,
          "colors": [
            "rgba(245, 54, 54, 0.9)",
            "rgba(237, 129, 40, 0.89)",
            "rgba(50, 172, 45, 0.97)"
          ],
          "dateFormat": "YYYY-MM-DD HH:mm:ss",
          "decimals": 0,
          "mappingType": 1,
          "pattern": "Average user_updates",
          "thresholds": [],
          "type": "number",
          "unit": "short"
        }
      ],
      "targets": [
        {
          "alias": "{{table_name.keyword}}.{{index_name.keyword}}",
          "bucketAggs": [
            {
              "fake": true,
              "field": "table_name.keyword",
              "id": "5",
              "settings": {
                "min_doc_count": 1,
                "order": "desc",
                "orderBy": "6",
                "size": "5"
              },
              "type": "terms"
            },
            {
              "fake": true,
              "field": "index_name.keyword",
              "id": "3",
              "settings": {
                "min_doc_count": 1,
                "order": "desc",
                "orderBy": "6",
                "size": "10"
              },
              "type": "terms"
            }
          ],
          "metrics": [
            {
              "field": "user_lookups",
              "hide": true,
              "id": "1",
              "meta": {},
              "settings": {},
              "type": "avg"
            },
            {
              "field": "user_scans",
              "hide": true,
              "id": "6",
              "meta": {},
              "settings": {},
              "type": "avg"
            },
            {
              "field": "user_seeks",
              "hide": true,
              "id": "7",
              "meta": {},
              "settings": {},
              "type": "avg"
            },
            {
              "field": "select field",
              "id": "8",
              "meta": {},
              "pipelineVariables": [
                {
                  "name": "var1",
                  "pipelineAgg": "1"
                },
                {
                  "name": "var2",
                  "pipelineAgg": "6"
                },
                {
                  "name": "var3",
                  "pipelineAgg": "7"
                },
                {
                  "name": "var4",
                  "pipelineAgg": "9"
                }
              ],
              "settings": {
                "script": "params.var4/(params.var1+params.var2+params.var3)"
              },
              "type": "bucket_script"
            },
            {
              "field": "user_updates",
              "hide": true,
              "id": "9",
              "meta": {},
              "settings": {},
              "type": "avg"
            }
          ],
          "query": "database_name.keyword:$Database AND user_lookups:[0 TO 100] AND user_scans:[0 TO 100] AND user_seeks:[0 TO 100]",
          "refId": "A",
          "timeField": "@timestamp"
        }
      ],
      "timeFrom": null,
      "timeShift": null,
      "title": "$Database - Underutilised indexes",
      "transform": "table",
      "type": "table"
    },
    {
      "collapsed": false,
      "datasource": null,
      "gridPos": {
        "h": 1,
        "w": 24,
        "x": 0,
        "y": 14
      },
      "id": 91,
      "panels": [],
      "title": "Missing Indexes",
      "type": "row"
    },
    {
      "columns": [],
      "datasource": "Elasticsearch [missing-indexes]",
      "fontSize": "100%",
      "gridPos": {
        "h": 5,
        "w": 24,
        "x": 0,
        "y": 15
      },
      "id": 89,
      "interval": "30m",
      "links": [],
      "maxPerRow": 2,
      "options": {},
      "pageSize": null,
      "repeat": "Database",
      "repeatDirection": "v",
      "scopedVars": {
        "Database": {
          "selected": true,
          "text": "",
          "value": ""
        }
      },
      "scroll": true,
      "showHeader": true,
      "sort": {
        "col": 6,
        "desc": true
      },
      "styles": [
        {
          "alias": "Table",
          "align": "auto",
          "dateFormat": "YYYY-MM-DD HH:mm:ss",
          "pattern": "table_name.keyword",
          "type": "string"
        },
        {
          "alias": "Index",
          "align": "auto",
          "colorMode": "value",
          "colors": [
            "rgba(50, 172, 45, 0.97)",
            "rgba(237, 129, 40, 0.89)",
            "rgba(245, 54, 54, 0.9)"
          ],
          "decimals": 2,
          "pattern": "sql_code.keyword",
          "thresholds": [
            ""
          ],
          "type": "string",
          "unit": "percent"
        },
        {
          "alias": "Impact",
          "align": "auto",
          "colorMode": null,
          "colors": [
            "rgba(245, 54, 54, 0.9)",
            "rgba(237, 129, 40, 0.89)",
            "rgba(50, 172, 45, 0.97)"
          ],
          "dateFormat": "YYYY-MM-DD HH:mm:ss",
          "decimals": 2,
          "mappingType": 1,
          "pattern": "Average",
          "sanitize": false,
          "thresholds": [],
          "type": "number",
          "unit": "none"
        },
        {
          "alias": "Seeks",
          "align": "auto",
          "colorMode": null,
          "colors": [
            "rgba(245, 54, 54, 0.9)",
            "rgba(237, 129, 40, 0.89)",
            "rgba(50, 172, 45, 0.97)"
          ],
          "dateFormat": "YYYY-MM-DD HH:mm:ss",
          "decimals": 0,
          "mappingType": 1,
          "pattern": "Average user_seeks",
          "thresholds": [],
          "type": "number",
          "unit": "none"
        }
      ],
      "targets": [
        {
          "alias": "",
          "bucketAggs": [
            {
              "fake": true,
              "field": "table_name.keyword",
              "id": "11",
              "settings": {
                "min_doc_count": 1,
                "order": "desc",
                "orderBy": "10",
                "size": "0"
              },
              "type": "terms"
            },
            {
              "fake": true,
              "field": "sql_code.keyword",
              "id": "4",
              "settings": {
                "min_doc_count": 1,
                "order": "desc",
                "orderBy": "10",
                "size": "0"
              },
              "type": "terms"
            }
          ],
          "metrics": [
            {
              "field": "overall_impact",
              "id": "10",
              "meta": {},
              "settings": {},
              "type": "avg"
            }
          ],
          "query": "database_name.keyword:$Database",
          "refId": "A",
          "timeField": "@timestamp"
        }
      ],
      "timeFrom": null,
      "timeShift": null,
      "title": "Missing indexes - $Database",
      "transform": "table",
      "type": "table"
    }
  ],
  "refresh": false,
  "schemaVersion": 22,
  "style": "dark",
  "tags": [],
  "templating": {
    "list": [
      {
        "allValue": null,
        "current": {
          "text": "",
          "value": [
            ""
          ]
        },
        "datasource": "Elasticsearch [index-stats]",
        "definition": "{\"find\": \"terms\",\"field\": \"database_name.keyword\"}",
        "hide": 0,
        "includeAll": true,
        "label": null,
        "multi": true,
        "name": "Database",
        "options": [],
        "query": "{\"find\": \"terms\",\"field\": \"database_name.keyword\"}",
        "refresh": 2,
        "regex": "",
        "skipUrlSync": false,
        "sort": 0,
        "tagValuesQuery": "",
        "tags": [],
        "tagsQuery": "",
        "type": "query",
        "useTags": false
      }
    ]
  },
  "time": {
    "from": "now-24h",
    "to": "now"
  },
  "timepicker": {
    "refresh_intervals": [
      "5s",
      "10s",
      "30s",
      "1m",
      "5m",
      "15m",
      "30m",
      "1h",
      "2h",
      "1d"
    ],
    "time_options": [
      "5m",
      "15m",
      "1h",
      "6h",
      "12h",
      "24h",
      "2d",
      "7d",
      "30d"
    ]
  },
  "timezone": "",
  "title": "Index Maintenance",
  "uid": "OQVK9BSWk",
  "version": 27
}

Monitoring SQL Server: fiddling with sp_whoisactive output

Building up on from basic telegraf inputs we now want some actual SQL data. And this time around it’s going to be not just numeric telemetry, we’d gain some insights into actual queries that get run.

Our choice of Elastic

Up to this point our choice of data back-end has been unjustified. Telegraf is intended to work with time series DBs like Influx. These are heavily optimised based on assumption what kind of data they store and query (i.e. timed series of events). Elastic is however a full text search. So it’s about the time we started to use it for what it was designed for, right?

Finding active sessions with queries and wait reasons

Taking a step back, we must acknowledge work of Adam Machanic and call out sp_whoisactive as probably the most useful tool every DBA should be aware of. This script provides great overview of what the system is doing right now, how long the session have been running for and what they are waiting on. It even allows for dumping data into predefined tables out of the box! Again, if we were looking to utilise SEL server for monitoring we could have easily gone this way and with a bit of SQL Agent scheduling we’d be done in no time.

There’s one slight issue with sp_whoisactive – it’s not meant to work with anything else but SQL table as data store. For our case it is not ideal . It also does not really know anything about SQL Server Query Store which we think is a nice to have.

It’s a known fact we can’t join results of a stored proc with other tables unless we store results in an interim temp table first. So we’d use sp_whoisactive‘s own temp table scripting facility to store results while we loop through query stores on all our databases to grab some extra bits of data we think might be useful:

DECLARE @table_schema NVARCHAR(MAX);
DECLARE @temp_table NVARCHAR(MAX);
DECLARE @result_table NVARCHAR(MAX);
SET NOCOUNT ON;
/*EXEC sp_WhoIsActive @get_outer_command = 1,
					@find_block_leaders = 1,
					@return_schema = 1,
					@format_output = 0,
					@schema = @table_schema OUTPUT;*/
SET @table_schema = N'CREATE TABLE <table_name> ( [session_id] smallint NOT NULL,[sql_text] nvarchar(max) NULL,[sql_command] nvarchar(max) NULL,[login_name] nvarchar(128) NOT NULL,[wait_info] nvarchar(4000) NULL,[CPU] int NULL,[tempdb_allocations] bigint NULL,[tempdb_current] bigint NULL,[blocking_session_id] smallint NULL,[blocked_session_count] smallint NULL,[reads] bigint NULL,[writes] bigint NULL,[physical_reads] bigint NULL,[used_memory] bigint NOT NULL,[status] varchar(30) NOT NULL,[open_tran_count] smallint NULL,[percent_complete] real NULL,[host_name] nvarchar(128) NULL,[database_name] nvarchar(128) NULL,[program_name] nvarchar(128) NULL,[start_time] datetime NOT NULL,[login_time] datetime NULL,[request_id] int NULL,[collection_time] datetime NOT NULL)';
SET @temp_table = REPLACE(@table_schema, '<table_name>', '#whoisactive_monitoring');
SET @result_table = REPLACE(@table_schema, '<table_name>', '#result');
SET @result_table = REPLACE(@result_table, 'NOT NULL)', 'NOT NULL,[duration] bigint NOT NULL DEFAULT 0)'); -- add placeholder for duration column 
SET @result_table = REPLACE(@result_table, 'DEFAULT 0)', 'DEFAULT 0,[query_text_id] bigint NULL)'); -- add placeholder for query_text_id from Query Store
---
DECLARE @db_name NVARCHAR(120);
DECLARE @enhance_sql NVARCHAR(MAX);

SET NOCOUNT ON
-- here we just build a list of databases on the server using known table Users as an anchor. Your databases will have other well known tables
DECLARE @dbs table ([db_name] sysname)
DECLARE @db_query_sql nvarchar(4000)
SET @db_query_sql='select ''?'' as [db_name] from [?].sys.tables t WHERE t.name = ''Users'''; 
INSERT INTO @dbs ([db_name]) EXEC sp_msforeachdb @db_query_sql
SET NOCOUNT OFF

DECLARE db_name_cursor CURSOR FOR
SELECT [db_name]
FROM @dbs
FOR READ ONLY;
OPEN db_name_cursor;
FETCH NEXT FROM db_name_cursor
INTO @db_name;
WHILE @@FETCH_STATUS = 0
BEGIN
	SET @enhance_sql
		= CONCAT(
					@enhance_sql,
					CHAR(13),
					CHAR(10),
					CAST(N'USE [' + @db_name + ']
						IF EXISTS(SELECT 1 FROM sys.database_query_store_options WHERE actual_state_desc <> ''OFF'')
						UPDATE #result 
						SET query_text_id = qsqt.query_text_id 
						FROM #result wm 
						LEFT JOIN sys.query_store_query_text qsqt ON wm.sql_text COLLATE DATABASE_DEFAULT = qsqt.query_sql_text COLLATE DATABASE_DEFAULT 
						WHERE wm.database_name = ''' + @db_name + ''';' AS NVARCHAR(MAX))
				);
	FETCH NEXT FROM db_name_cursor
	INTO @db_name;
END;
CLOSE db_name_cursor;
DEALLOCATE db_name_cursor;
---
DECLARE @main_script NVARCHAR(MAX);
SET @main_script
	= CAST(CONCAT(
						@temp_table, N';',
						CHAR(13),
						CHAR(10),
						'USE [master]; EXEC [master].[dbo].sp_WhoIsActive @get_outer_command=1, @find_block_leaders=1,@format_output=0, @destination_table=''#whoisactive_monitoring'';',
						CHAR(13),
						CHAR(10),
						@result_table, ';',
						CHAR(13),
						CHAR(10),
						N'INSERT INTO #result SELECT	wm.*, 
													CASE
														WHEN DATEDIFF(hour, wm.start_time, wm.collection_time) > 576 THEN
															DATEDIFF(second, wm.collection_time, wm.start_time)
														ELSE DATEDIFF(ms, wm.start_time, wm.collection_time)
													END AS duration, 
													NULL 
											FROM #whoisactive_monitoring wm;',
						CHAR(13),
						CHAR(10),
						@enhance_sql,
						CHAR(13),
						CHAR(10),
						N'DROP TABLE #whoisactive_monitoring;',
						CHAR(13),
						CHAR(10),
						N'SELECT * FROM #result;DROP TABLE #result;'
					) AS NVARCHAR(MAX));
--PRINT @main_script
EXEC (@main_script);

Now that we’ve got the data

We want Logstash to push the output of this query into Elastic. This way we will always have some idea what’s been going on the DB server. One way to run queries against SQL is JDBC driver – download .jre8.jar, unpack and remember the location.

Defining pipeline

After we’ve got the driver, everything else is easy: the pipeline is literally one input and one output:

input {
	############################################################# Master sp_WhoIsActive ############################################################################
	jdbc {
		id => "master_spWhoIsActive"
		jdbc_driver_library => "path\to\jdbc\lib\mssql-jdbc-7.2.1.jre8.jar"
		jdbc_driver_class => "com.microsoft.sqlserver.jdbc.SQLServerDriver"
		jdbc_connection_string => "jdbc:sqlserver://<your connection string>"
		jdbc_user => nil
		schedule => "* * * * *" ## runs each minute
		statement => "-- literally paste sql code from above inside quotes here"
		add_field => {
						"database" => "master" ## optionally add more fields to distinguish where data comes from
						"instance" => "MY-SQL-Server"
					}
	}
	################################################################################################################################################################	
}
output {
	elasticsearch {
		hosts => "elasticsearch:9200"
		index => "whoisactive-%{+YYYY.MM}"            
	}
}

Restart Logstash and watch Kibana updating with new events!

Monitoring SQL Server: setting up Logstash with telegraf

Having set up basic ELK stack we probably should get on to ingesting some data.

Wait, what about schema?

Theoretically, we could play it very strict and define our expected documetns similar to the way we define SQL tables. But it’s not fun and besides, Elastic comes with sensible defaults. It has done a decent enough job for us to have never needed to correct it. Not bad at all.

Setting up the pipeline

Logstash operates in terms of pipelines. If I were to reduce it to the bare basics, each pipeline allows us to define where data comes from (input), how Logstash should pick events to process it (filter) and finally, where to send it to (output). The last bit is kinda obvious and easy – we want to send processed events to Elastic. And by virtue of running doker we happen to know that it’s hosted at http://elasticsearch:9200. Too easy.

Input

Being quite modular, Logstash operates in terms of plugins. And there are HEAPS to chose from! Apart from obvious bits you get to see in the documentation, one thing that might not be quite obvious – you can have multiple plugins running for one input stream!

Our telemetry agent of choice, telegraf supports sending metrics via Influx Line Protocol, but Logstash does not have a plugin for that – so we will need to craft something bit more complex. Suppose we want basic metrics and sql-stats

input {
	tcp {
		port => 8098
		type => "telegraf"
	} # opens up a TCP listener for events sent by telegraf (which happens to support Influx Line Protocol)
	tcp {
		port => 8099
		type => "sql-stats"
	} # opens up a TCP listener for events coded in Influx Line protocol
}

Filter

This bit is optional, but sometimes is very helpful. And again, we’ve got quite a variety of plugins to suit. Here we’ve got a chance to inspect incoming events and either transform or outright reject some. For example here we parse Influx Line protocol sent by telegraf and do some basic enhancements on data coming from SQL-stats poller:

filter {
	if [type] == "telegraf" {		
		dissect {
			mapping => {
				"message" => "%{measurement}.%{metric};%{tags} %{value} %{ts}"
			}
		}
		kv {
			source => "tags"
			field_split => ";"
		}	
		date {
			match => ["ts", "UNIX"]
		}
		mutate {
			convert => {
				"value" => "float"
			}
			remove_field => ["tags", "message", "ts", "port"]
		}
	}
	if [type] == "sql-stats" {		
		grok {
			match => {
				"message" => "%{WORD:measurement}(\.%{WORD:metric})?;%{GREEDYDATA:tags} (%{BASE10NUM:value}) %{NUMBER:ts}"
			}
		}
		kv {
			source => "tags"
			field_split => ";"
		}	
		date {
			match => ["ts", "UNIX"]
		}
		mutate {
			convert => {
				"value" => "float"
			}
			rename => {
				"counter" => "metric"
				"clerk_type" => "metric"
			}
			remove_field => ["tags", "message", "ts", "port", "host"]
		}
	}
}

All that’s left

To store the events, we invoke output like so:

output {
	if [type] == "telegraf" {		
		elasticsearch {
			hosts => "elasticsearch:9200"
			index => "telegraf-%{+YYYY.MM}"
		}
	}
	if [type] == "sql-stats" {		
		elasticsearch {
			hosts => "elasticsearch:9200"
			index => "sql-stats-%{+YYYY.MM}"
		}
	}
}

Monitoring SQL Server: setting up ELK+G

In 9 cases out of 10 our clients have some sort of database that they want to interface with. And 8 out of those 9 cases the database is going to be SQL Server. Yes, this is us being biased, but you know what?

It does not matter

The important bit is – out clients like to know how the database is doing. Some are happy to pay for commercial APMs, others either have very specific needs or love the challenge to DIY.

We are here to help

One way to get better picture of what’s happening with the DB would be to keep grabbing vitals over time and plotting them on a graph of some sort. Grafana is a fantastic way to achieve that. It supports a whole bunch of backends (including SQL server) and allows insane amount of customisations.

Diversify

It is possible to store SQL telemetry in another SQL database on the same server (you could even set up SQL Agent jobs to do the polling – all nicely packaged). We however thought it might be a good idea to not store all data on the same machine. We’d like to not overstrain the main database in time of pinch and completely decouple analytics from critical business processes.

ELK G stack

One of many ways to approach this is to introduce a (somewhat) free and open source ElasticSearch into the mix. And mightly Logstash for data ingestion. This is where we’d normally go on to Kibana for dashboards and nice UI (and we did end up running it), but the main focus of this exercise will still fall onto Grafana.

Setting it up

Theres no point repeating official documentation for respective products, let’s instead write up a docker-compose file:

version: '3'
services:
    elasticsearch:
        image: docker.elastic.co/elasticsearch/elasticsearch:7.6.1
        environment:
            - node.name=elastic01
            - discovery.type=single-node  
            - bootstrap.memory_lock=true
            - "ES_JAVA_OPTS=-Xms512m -Xmx512m"        
        volumes:
            - ./elastic:/usr/share/elasticsearch/data
    logstash:
        image: docker.elastic.co/logstash/logstash:7.6.1
        volumes: 
            - ./logstash-pipeline:/usr/share/logstash/pipeline/
            - ./logstash-config/usr/share/logstash/config/
        depends_on:
          - elasticsearch
    kibana:
        image: docker.elastic.co/kibana/kibana:7.6.1
        environment:
          - ELASTICSEARCH_HOSTS=http://elasticsearch:9200
        ports:
          - 5601:5601
        depends_on:
          - elasticsearch
    grafana:
        image: grafana/grafana
        ports:
          - 3000:3000
        depends_on:
          - elasticsearch

All that’s left to do is docker-compose up -d and run. Stay tuned for next posts in the series.