
Building up on from basic telegraf inputs we now want some actual SQL data. And this time around it’s going to be not just numeric telemetry, we’d gain some insights into actual queries that get run.
Our choice of Elastic
Up to this point our choice of data back-end has been unjustified. Telegraf is intended to work with time series DBs like Influx. These are heavily optimised based on assumption what kind of data they store and query (i.e. timed series of events). Elastic is however a full text search. So it’s about the time we started to use it for what it was designed for, right?
Finding active sessions with queries and wait reasons
Taking a step back, we must acknowledge work of Adam Machanic and call out sp_whoisactive as probably the most useful tool every DBA should be aware of. This script provides great overview of what the system is doing right now, how long the session have been running for and what they are waiting on. It even allows for dumping data into predefined tables out of the box! Again, if we were looking to utilise SEL server for monitoring we could have easily gone this way and with a bit of SQL Agent scheduling we’d be done in no time.
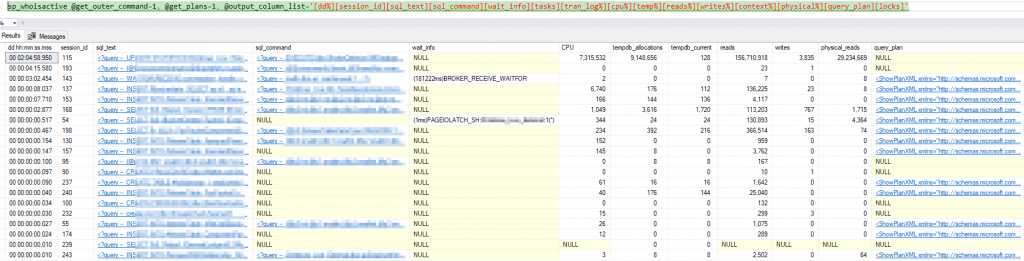
There’s one slight issue with sp_whoisactive – it’s not meant to work with anything else but SQL table as data store. For our case it is not ideal . It also does not really know anything about SQL Server Query Store which we think is a nice to have.
It’s a known fact we can’t join results of a stored proc with other tables unless we store results in an interim temp table first. So we’d use sp_whoisactive‘s own temp table scripting facility to store results while we loop through query stores on all our databases to grab some extra bits of data we think might be useful:
DECLARE @table_schema NVARCHAR(MAX);
DECLARE @temp_table NVARCHAR(MAX);
DECLARE @result_table NVARCHAR(MAX);
SET NOCOUNT ON;
/*EXEC sp_WhoIsActive @get_outer_command = 1,
					@find_block_leaders = 1,
					@return_schema = 1,
					@format_output = 0,
					@schema = @table_schema OUTPUT;*/
SET @table_schema = N'CREATE TABLE <table_name> ( [session_id] smallint NOT NULL,[sql_text] nvarchar(max) NULL,[sql_command] nvarchar(max) NULL,[login_name] nvarchar(128) NOT NULL,[wait_info] nvarchar(4000) NULL,[CPU] int NULL,[tempdb_allocations] bigint NULL,[tempdb_current] bigint NULL,[blocking_session_id] smallint NULL,[blocked_session_count] smallint NULL,[reads] bigint NULL,[writes] bigint NULL,[physical_reads] bigint NULL,[used_memory] bigint NOT NULL,[status] varchar(30) NOT NULL,[open_tran_count] smallint NULL,[percent_complete] real NULL,[host_name] nvarchar(128) NULL,[database_name] nvarchar(128) NULL,[program_name] nvarchar(128) NULL,[start_time] datetime NOT NULL,[login_time] datetime NULL,[request_id] int NULL,[collection_time] datetime NOT NULL)';
SET @temp_table = REPLACE(@table_schema, '<table_name>', '#whoisactive_monitoring');
SET @result_table = REPLACE(@table_schema, '<table_name>', '#result');
SET @result_table = REPLACE(@result_table, 'NOT NULL)', 'NOT NULL,[duration] bigint NOT NULL DEFAULT 0)'); -- add placeholder for duration column
SET @result_table = REPLACE(@result_table, 'DEFAULT 0)', 'DEFAULT 0,[query_text_id] bigint NULL)'); -- add placeholder for query_text_id from Query Store
---
DECLARE @db_name NVARCHAR(120);
DECLARE @enhance_sql NVARCHAR(MAX);

SET NOCOUNT ON
-- here we just build a list of databases on the server using known table Users as an anchor. Your databases will have other well known tables
DECLARE @dbs table ([db_name] sysname)
DECLARE @db_query_sql nvarchar(4000)
SET @db_query_sql='select ''?'' as [db_name] from [?].sys.tables t WHERE t.name = ''Users''';
INSERT INTO @dbs ([db_name]) EXEC sp_msforeachdb @db_query_sql
SET NOCOUNT OFF

DECLARE db_name_cursor CURSOR FOR
SELECT [db_name]
FROM @dbs
FOR READ ONLY;
OPEN db_name_cursor;
FETCH NEXT FROM db_name_cursor
INTO @db_name;
WHILE @@FETCH_STATUS = 0
BEGIN
	SET @enhance_sql
		= CONCAT(
					@enhance_sql,
					CHAR(13),
					CHAR(10),
					CAST(N'USE [' + @db_name + ']
						IF EXISTS(SELECT 1 FROM sys.database_query_store_options WHERE actual_state_desc <> ''OFF'')
						UPDATE #result
						SET query_text_id = qsqt.query_text_id
						FROM #result wm
						LEFT JOIN sys.query_store_query_text qsqt ON wm.sql_text COLLATE DATABASE_DEFAULT = qsqt.query_sql_text COLLATE DATABASE_DEFAULT
						WHERE wm.database_name = ''' + @db_name + ''';' AS NVARCHAR(MAX))
				);
	FETCH NEXT FROM db_name_cursor
	INTO @db_name;
END;
CLOSE db_name_cursor;
DEALLOCATE db_name_cursor;
---
DECLARE @main_script NVARCHAR(MAX);
SET @main_script
	= CAST(CONCAT(
						@temp_table, N';',
						CHAR(13),
						CHAR(10),
						'USE [master]; EXEC [master].[dbo].sp_WhoIsActive @get_outer_command=1, @find_block_leaders=1,@format_output=0, @destination_table=''#whoisactive_monitoring'';',
						CHAR(13),
						CHAR(10),
						@result_table, ';',
						CHAR(13),
						CHAR(10),
						N'INSERT INTO #result SELECT	wm.*,
													CASE
														WHEN DATEDIFF(hour, wm.start_time, wm.collection_time) > 576 THEN
															DATEDIFF(second, wm.collection_time, wm.start_time)
														ELSE DATEDIFF(ms, wm.start_time, wm.collection_time)
													END AS duration,
													NULL
											FROM #whoisactive_monitoring wm;',
						CHAR(13),
						CHAR(10),
						@enhance_sql,
						CHAR(13),
						CHAR(10),
						N'DROP TABLE #whoisactive_monitoring;',
						CHAR(13),
						CHAR(10),
						N'SELECT * FROM #result;DROP TABLE #result;'
					) AS NVARCHAR(MAX));
--PRINT @main_script
EXEC (@main_script);
Now that we’ve got the data
We want Logstash to push the output of this query into Elastic. This way we will always have some idea what’s been going on the DB server. One way to run queries against SQL is JDBC driver – download .jre8.jar, unpack and remember the location.
Defining pipeline
After we’ve got the driver, everything else is easy: the pipeline is literally one input and one output:
input {
	############################################################# Master sp_WhoIsActive ############################################################################
	jdbc {
		id => "master_spWhoIsActive"
		jdbc_driver_library => "path\to\jdbc\lib\mssql-jdbc-7.2.1.jre8.jar"
		jdbc_driver_class => "com.microsoft.sqlserver.jdbc.SQLServerDriver"
		jdbc_connection_string => "jdbc:sqlserver://<your connection string>"
		jdbc_user => nil
		schedule => "* * * * *" ## runs each minute
		statement => "-- literally paste sql code from above inside quotes here"
		add_field => {
						"database" => "master" ## optionally add more fields to distinguish where data comes from
						"instance" => "MY-SQL-Server"
					}
	}
	################################################################################################################################################################
}
output {
	elasticsearch {
		hosts => "elasticsearch:9200"
		index => "whoisactive-%{+YYYY.MM}"
	}
}
Restart Logstash and watch Kibana updating with new events!
One thought on “Monitoring SQL Server: fiddling with sp_whoisactive output”
Comments are closed.