Imagine a situation where you’d like to attach a debugger to an assembly that you have loaded dynamically? To make it a bit more plausible let us consider a scenario. Our client has a solution where they maintain extensive plugin ecosystem. Each plugin is a class library built with .net 4.5. Each plugin implements a common interface that main application is aware of. At runtime the application scans a folder and loads all assemblies into separate AppDomains. Under certain circumstances users/developers would like to be able to debug plugins in Visual Studio.
Given how seldom we would opt for this technique, documenting our solution might be an exercise in vain. But myself being a huge fan of weird and wonderful – I couldn’t resist going through with this case study.
Inventorying moving parts
First of all we’d need a way to inject code into the assembly. Apparently we can not directly replace methods we loaded from disk – SwapMethodBody() needs a DynamicModule. So we opted to define a subclass wrapper. Next, we need to actually stop execution and offer developers to start debugging. Using Debugger.Launch() is the easiest way to achieve that. Finally, we’d look at different ways to load assemblies into separate AppDomains to maintain existing convention.
Injecting Debugger.Launch()
The main attraction here – and Reflection.Emit is a perfect candidate for the job. Theory is fairly simple: we create a new dynamic assembly, module, type and a method. Then we generate code inside of the method and return wrapper instance:
public static object CreateWrapper(Type ServiceType, MethodInfo baseMethod)
{
    var asmBuilder = AppDomain.CurrentDomain.DefineDynamicAssembly(new AssemblyName($"newAssembly_{Guid.NewGuid()}"), AssemblyBuilderAccess.Run);
    var module = asmBuilder.DefineDynamicModule($"DynamicAssembly_{Guid.NewGuid()}");
    var typeBuilder = module.DefineType($"DynamicType_{Guid.NewGuid()}", TypeAttributes.Public, ServiceType);
    var methodBuilder = typeBuilder.DefineMethod("Run", MethodAttributes.Public | MethodAttributes.NewSlot);

    var ilGenerator = methodBuilder.GetILGenerator();

    ilGenerator.EmitCall(OpCodes.Call, typeof(Debugger).GetMethod("Launch", BindingFlags.Static | BindingFlags.Public), null);
    ilGenerator.Emit(OpCodes.Pop);

    ilGenerator.Emit(OpCodes.Ldarg_0);
    ilGenerator.EmitCall(OpCodes.Call, baseMethod, null);
    ilGenerator.Emit(OpCodes.Ret);

    /*
     * the generated method would be roughly equivalent to:
     * new void Run()
     * {
     *   Debugger.Launch();
     *   base.Run();
     * }
     */

    var wrapperType = typeBuilder.CreateType();
    return Activator.CreateInstance(wrapperType);
}
Triggering the method
After we’ve generated a wrapper – we should be in position to invoke the desired method. In this example I’m using all-reflection approach:
public void Run()
{
    var wrappedInstance = DebuggerWrapperGenerator.CreateWrapper(ServiceType, ServiceType.GetMethod("Run"));
    wrappedInstance.GetType().GetMethod("Run")?.Invoke(wrappedInstance, null);
 // nothing special here
}
The task becomes even easier if we know the interface to cast to.
Adding AppDomain into the mix
The above parts don’t depend much on where the code will run. However, trying to satisfy the layout requirement, we experimented with a few different configurations. In the end it appears that I’m able to confidently place the code in correct AppDomain by either leveraging .DoCallBack() or making sure that Launcher helper is created with .CreateInstanceAndUnwrap():
static void Main(string[] args)
{
    var appDomain = AppDomain.CreateDomain("AppDomainInMain", AppDomain.CurrentDomain.Evidence,
        new AppDomainSetup { ApplicationBase = AppDomain.CurrentDomain.SetupInformation.ApplicationBase });

    appDomain.DoCallBack(() =>
    {
        var launcher = new Launcher(PathToDll);
        launcher.Run();
    });
}
static void Main(string[] args)
{
Launcher.RunInNewAppDomain(PathToDll);
}
public class Launcher : MarshalByRefObject
{
private Type ServiceType { get; }
public Launcher(string pathToDll)
{
var assembly = Assembly.LoadFrom(pathToDll);
ServiceType = assembly.GetTypes().SingleOrDefault(t => t.Name == "Class1");
}
public void Run()
{
var wrappedInstance = DebuggerWrapperGenerator.CreateWrapper(ServiceType, ServiceType.GetMethod("Run"));
wrappedInstance.GetType().GetMethod("Run")?.Invoke(wrappedInstance, null);
}
public static void RunInNewAppDomain(string pathToDll)
{
var appDomain = AppDomain.CreateDomain("AppDomainInLauncher", AppDomain.CurrentDomain.Evidence, AppDomain.CurrentDomain.SetupInformation);
var launcher = appDomain.CreateInstanceAndUnwrap(typeof(Launcher).Assembly.FullName, typeof(Launcher).FullName, false, BindingFlags.Public|BindingFlags.Instance,
null, new object[] { pathToDll }, CultureInfo.CurrentCulture, null);
(launcher as Launcher)?.Run();
}
}Testing it
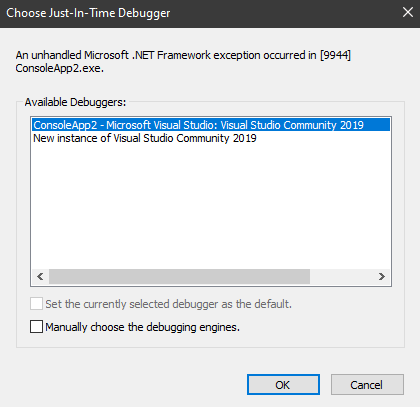
In the end we’ve got the following prompt:
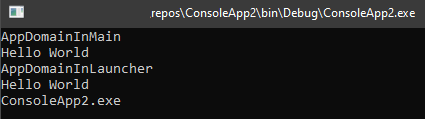
after letting it run through, we’d get something looking like this:
As usual, full code for this example sits in my GitHub if you want to take it for a spin.